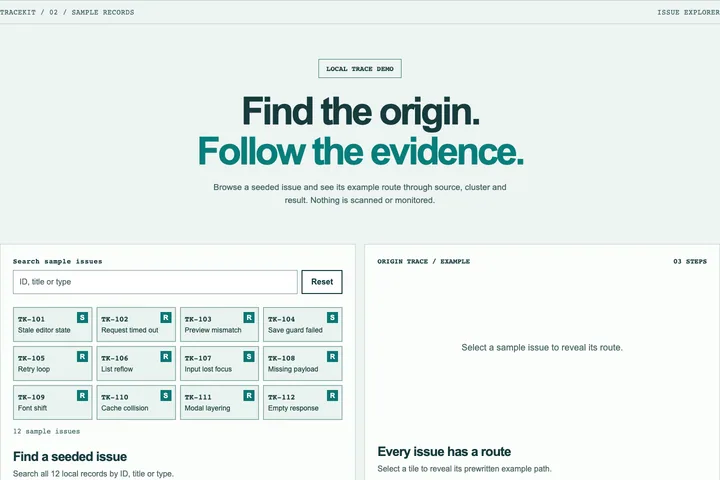
Tracekit issue explorer
A local searchable issue directory and seeded three-step trace.
Library
Metric cards, chart panels, data tables, scorecards and diagnostics views for dashboards and admin interfaces.
A local searchable issue directory and seeded three-step trace.
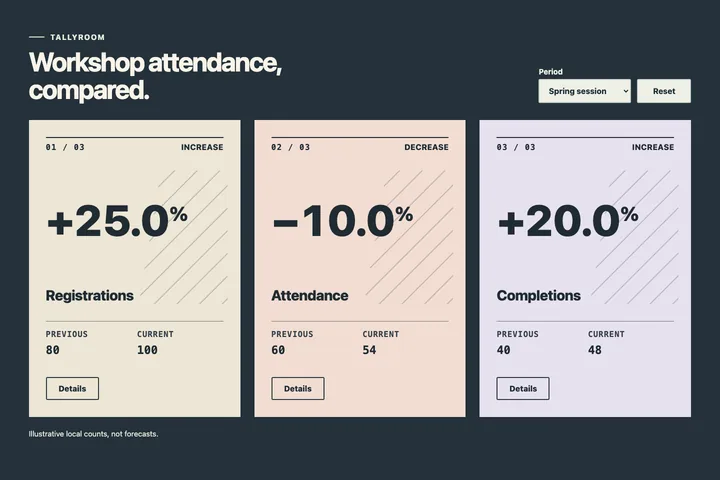
Three equal metric posters compare local workshop attendance counts across two sample periods.
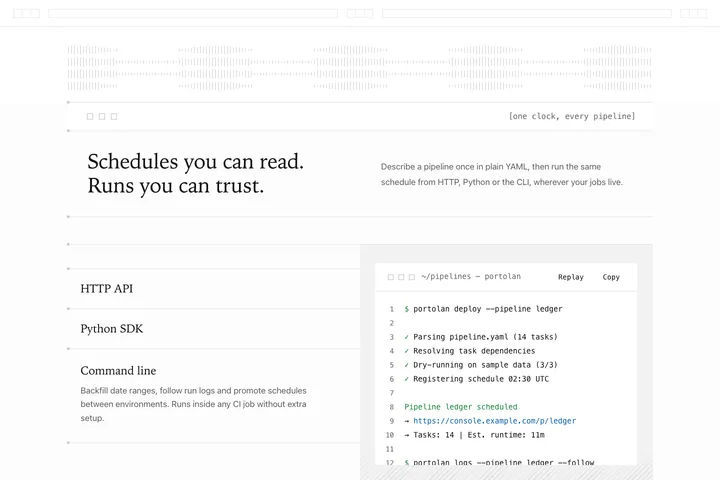
A developer-platform section for a fictional pipeline scheduler: square ghost navigation marks and a band of fine vertical ticks over a white chrome bar with three outlined square marks and a bracketed monospace tagline, a split header with a two-line serif headline and a grey paragraph, then a list of three feature disclosures on hairline rules beside a light grey panel whose square-cornered white terminal card shows twelve numbered lines of example output for the open row, over a diagonal hatch strip.
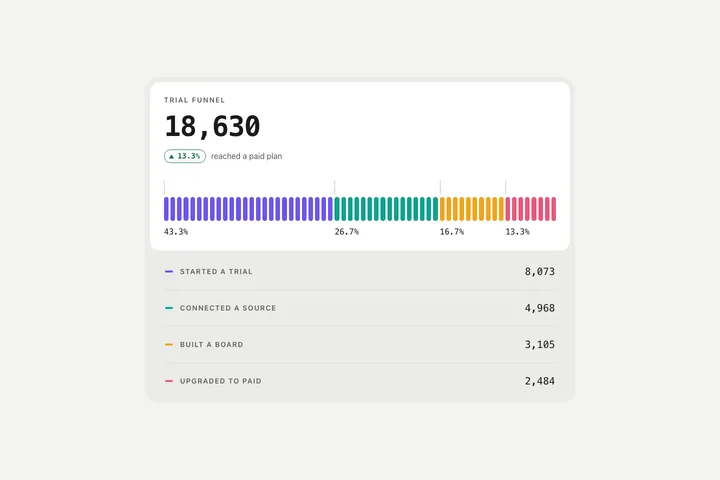
A conversion funnel metric card: a white panel nested in a grey tray stacks a tracked title, one dominant monospace total, an outlined delta chip, and a row of thirty narrow rounded bars split into contiguous stage runs with a dashed boundary rule and a percentage at every run start; the tray below lists one selectable legend row per stage with its marker, label and count.
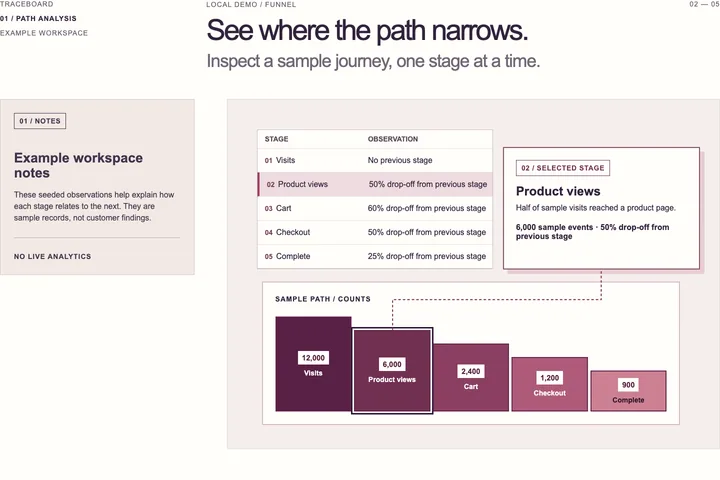
A seeded five-stage funnel with linked issue rows, selected detail and exact drop-off arithmetic.
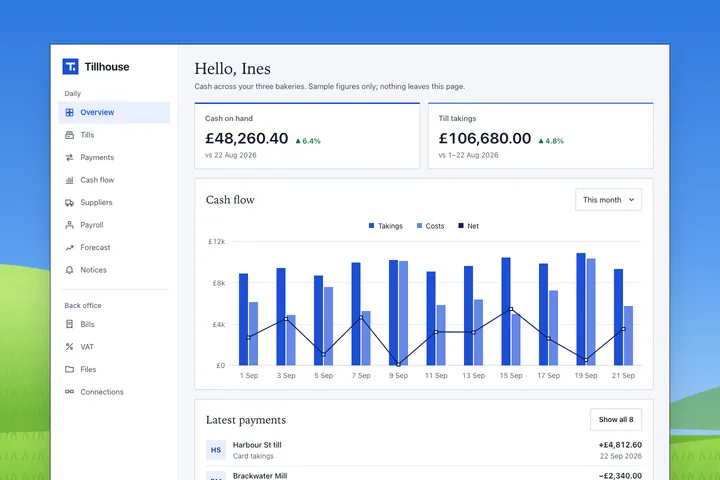
A cash overview for Tillhouse, a fictional three-shop bakery chain, shown as a large dashboard window with a 1px dark square frame floating over an original sky-over-meadow illustration: a sidebar with the brand, two sentence-case nav groups (8 + 4 links, Overview active on a pale blue row), a Plus card with a cobalt button that opens an honest local dialog and a user row; a main column with a serif greeting and subline, two square-cornered KPI cards with coloured top rules and plain triangle deltas, a Cash flow card with a period select, square legend toggles and a square-topped takings and costs bar chart under a straight net polyline with square markers, a keyboard-reachable tooltip and a visually hidden data table, and a Latest payments list with square initials tiles and a Show all toggle.

A locally selectable ceramic cross-section preview with illustrative sample properties.
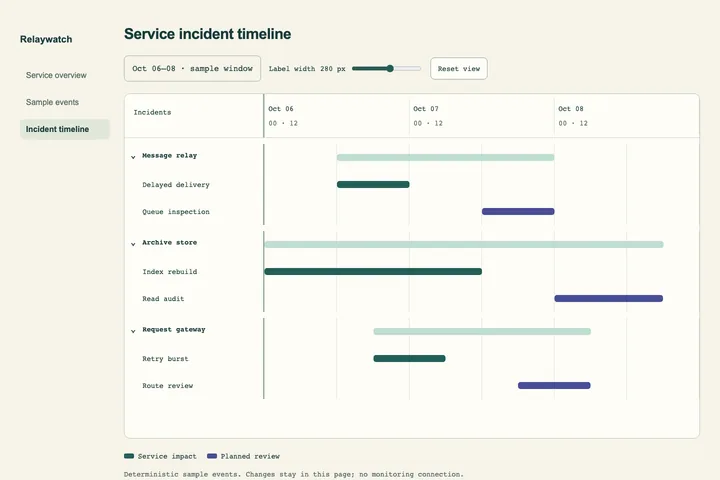
A service incident timeline with expandable grouped events and an accessible native range for label-column width.
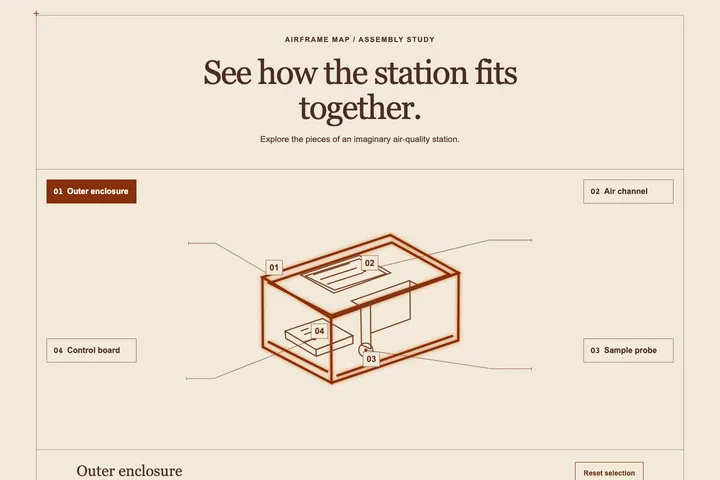
Original local annotated drawing of an imaginary air station, adapted from a frozen source relationship.
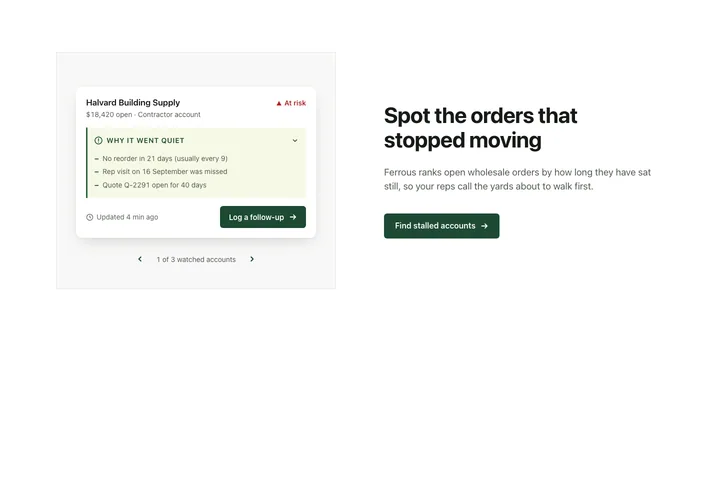
A stall watch for Ferrous, a fictional wholesale hardware distributor: a square, hairlined very light grey stage holds one centred rounded white risk card beside a text column with a heavy sans heading, a grey paragraph and a filled deep green action. The card shows the account name with a red triangle marker, the open order value, a pale chartreuse reasons box with a green left rule and three dash-led reasons behind a disclosure, and a footer with a freshness note and a filled action that opens a local note composer; a small pager cycles three sample accounts.
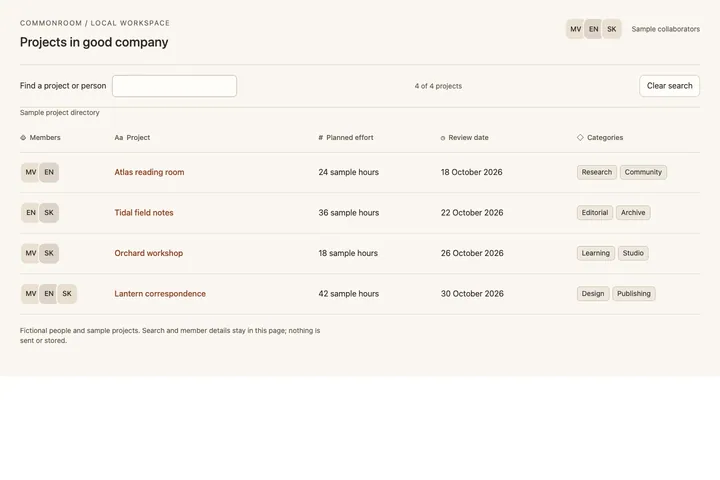
A calm collaborative project table with literal sample members, truthful local search and keyboard-accessible person details.
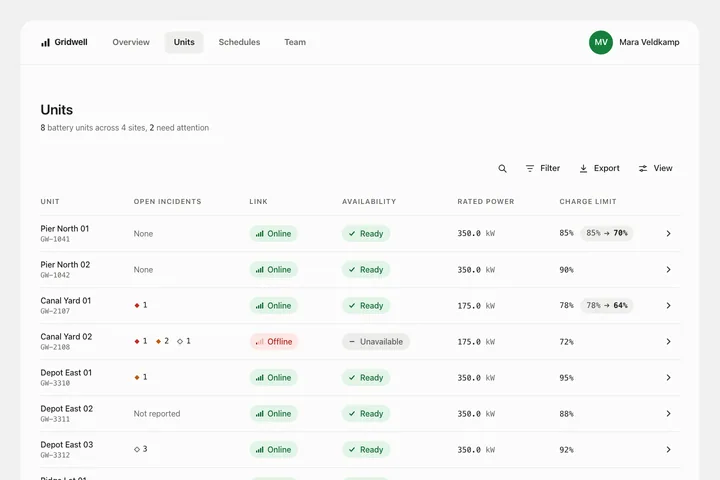
An app panel with a fleet data table: section tabs and user in the top bar, a right-aligned toolbar floating above a wide hairline table, borderless tinted status pills, mono tabular numerals, and a charge-limit cell whose inline scheduled-change chip explains the pending change in a tooltip on hover and keyboard focus.
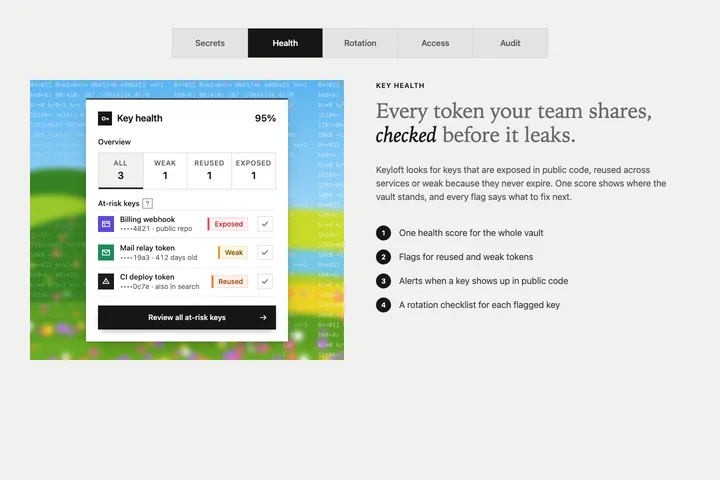
A key-health section for Keyloft, a fictional team secrets vault: a centred five-segment square tab bar with the active tab filled dark sits above two columns; on the left a compact square stats card with a 2px dark top rule floats on a vivid, softly blurred illustrated meadow with a faint character grid (score, a four-cell counter strip that filters the list, three at-risk keys with outlined status tags and mark-fixed actions, and a dark full-width review action); on the right an uppercase label, a serif heading in grey with one italic near-black word, a paragraph and four numbered bullets. Every action is local and says so.
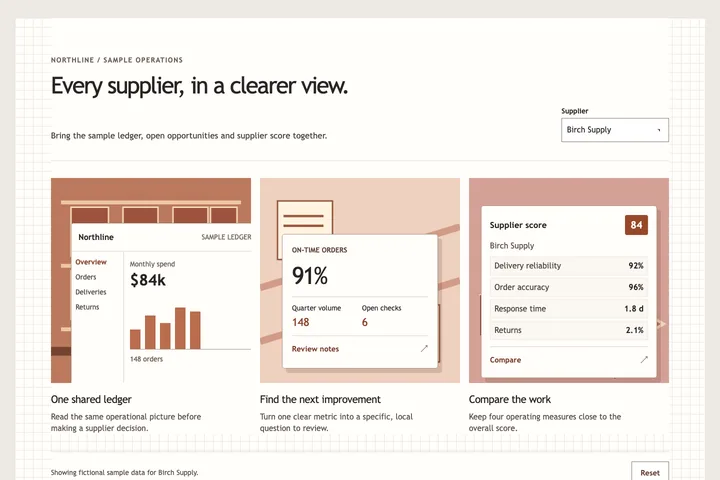
A three-panel supplier overview with sample ledger, opportunity and operational score.
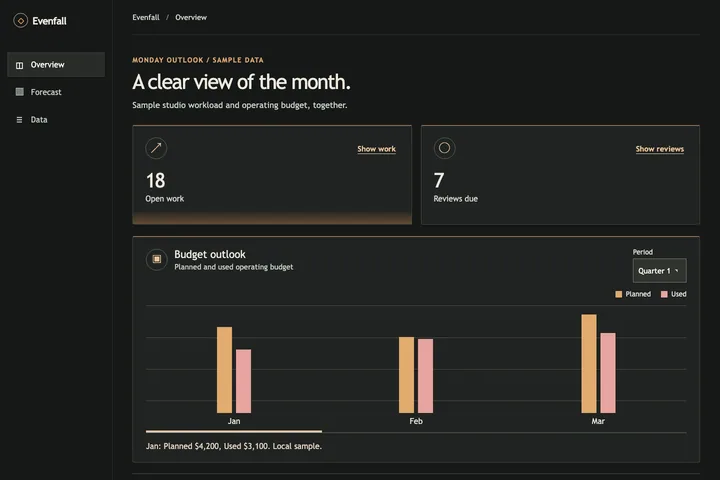
A dark dashboard with a complete rail, paired workload metrics and interactive planned-versus-used budget chart.
Try a broader search or clear the current filters.